Clinical Example
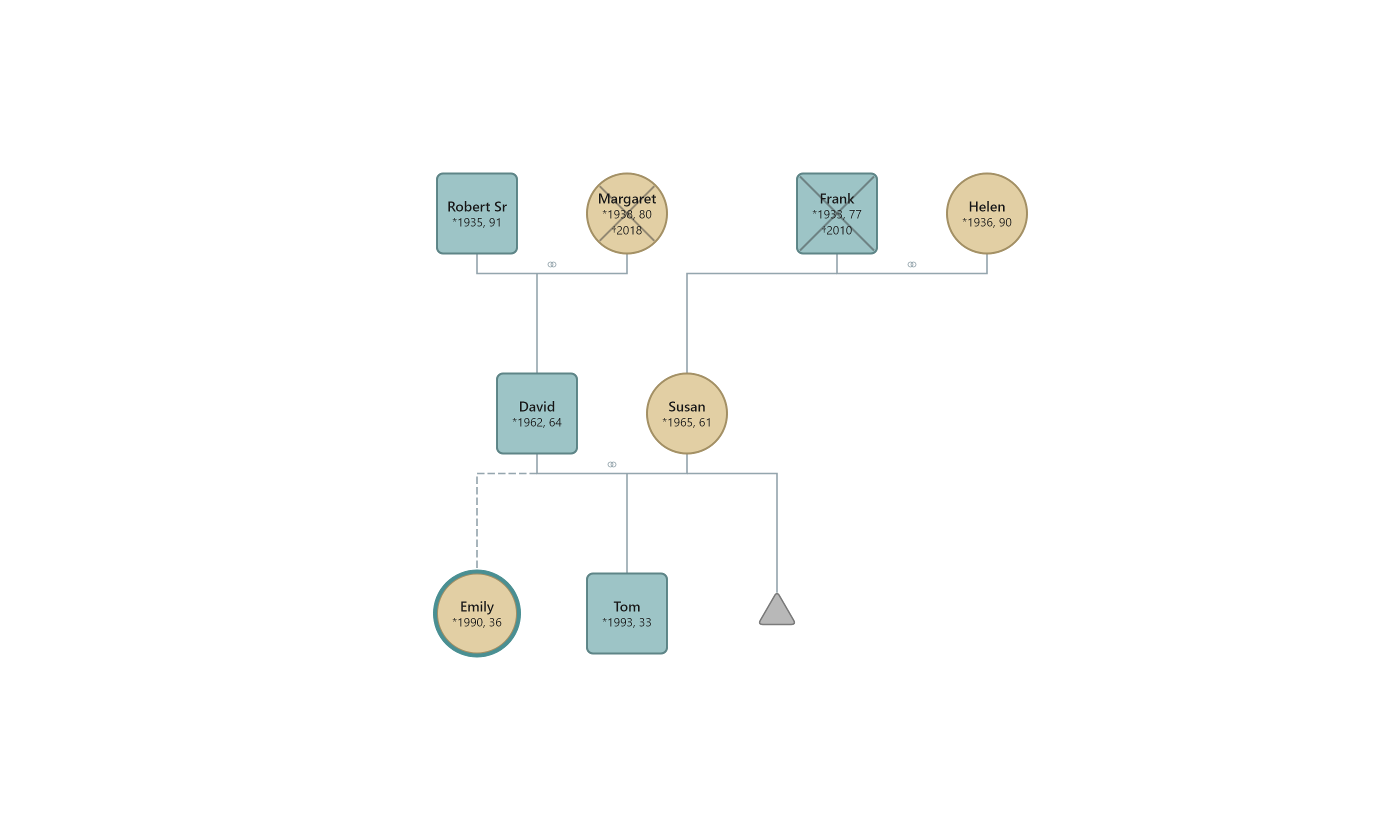
This sample is a fully anonymised, fictional three-generation family designed to demonstrate clinical features of genogram notation. It is not based on any real individual or case. All names and dates are invented for illustrative purposes.
The clinical example is the sample most directly relevant to the primary users of WinGeno: family therapists, social workers, counsellors, and other helping professionals who create genograms as part of their assessment and treatment planning work.
What the Sample Shows
The genogram covers three generations of a fictional family and demonstrates several core notation features:
Generation I — Paternal side
Robert Sr. (b. 1935) and Margaret (b. 1938, d. 2018) are the paternal grandparents. Margaret is deceased, indicated by an X through her symbol.
Generation I — Maternal side
Frank (b. 1933, d. 2010) and Helen (b. 1936) are the maternal grandparents. Frank is deceased.
Generation II — Parents
David (b. 1962), son of Robert Sr. and Margaret, and Susan (b. 1965), daughter of Frank and Helen, are married. Their couple connection forms the central node of the second generation.
Generation III — Children
David and Susan have three children:
- Emily (b. 1990) — the identified person, marked with a double border. Emily is adopted, shown by a dashed child connection line.
- Tom (b. 1993) — biological child.
- A current pregnancy, shown as a triangle symbol.
advertisement
Reading the Genogram Clinically
Even in this compact, anonymised family, the diagram immediately surfaces questions relevant to a first clinical session:
- Emily's adoption is structurally visible at a glance — her position in the sibling row is identical to Tom's, but the dashed line flags a different entry into the family system.
- The presence of a current pregnancy alongside two existing children prompts exploration of how the family system is preparing for change.
- The deaths of paternal grandmother Margaret and maternal grandfather Frank invite discussion of loss and how it has been processed across the family.
- As the identified person, Emily's double border signals that she is the focus of the clinical referral — a starting point, not a conclusion.
This is exactly the kind of rapid, multi-hypothesis picture that a genogram is designed to produce — a visual map that prompts questions and frames a treatment plan in its first session.
Further Reading
- McGoldrick, M., Gerson, R., & Petry, S. (2008). Genograms: Assessment and Intervention (3rd ed.). W. W. Norton.
- Bowen, M. (1978). Family Therapy in Clinical Practice. Jason Aronson.
- Genograms in Family Therapy — WinGeno Article